Targets / Sinks
InfluxDB
Suppose you're measuring values coming from a car. This is what that could look like:
- Events will be logged to InfluxDb like such: "pointName, event=template, ctx1=ctxval1, ctx2=ctxval2 field1=fieldval1, field2=fieldval2 value=1i 14566666xxxx"
- In other words, fields will be influx values and context fields will be influx tags.
- The timestamp of the Message will be at the end as the timestamp of the sent line
- Events will be logged in these influx measure names, so that you could e.g. put "event_fatal" as an annotation in Grafana:
- event_verbose
- event_debug
- event_info
- event_warn
- event_error
- event_fatal
File target
Logary's file target is primarily geared towards systems that are running on single machines as it prints a human-readable format, rather than a machine- readable one.
Configuration
The default configuration of the file target rotates log files greater than 200 MiB and deletes log files when the configured folder size is larger than 3 GiB.
Folders that don't exist when the target starts are automatically created on target start-up in the current service's security context. Should the calls to create the folder fail, the target is never started, but will restart continuously like any ther Logary target.
let fileConf =
  { File.FileConf.create logDir (Naming ("{service}-{host}-{datetime}", "log")) }

// ... withTargets [
  File.create fileConf "file"
// ] ...
Or in C#:
// set 'logDir' to specific path like Environment.CurrentDirectory if you are on windows
.Target<File.Builder>(
    "file",
    file => file.Target.FileSystem(new FileSystem.DotNetFileSystem(logDir))
                       .Naming("{service}-{host}-{datetime}", "log").Done())
Policies & specifications
You can specify a number of deletion and rotation policies when configuring the file target. The deletion policies dictate when the oldest logs should be deleted, whilst the rotation policies dictates when the files should be rotated (thereby the previous file archived).
Furthermore, you can specify a naming specification that dictates how the files should be named on disk.
- Deletion of files happen directly when at least one deletion policy has triggered.
- Rotation of files happen directly when at least one rotation policy has triggered.
- Naming specifications should automatically be amended with sequence number, should that be required.
Performance
The File target is a performance-optimised target. Logging always happens on a separate thread from the caller, so we try to reach a balance between throughput and latency on ACKs.
On Windows, overlapped IO is not used, because the files are opened in Append mode, should have equivalent performance. This means we should have similar performance on Linux and Windows.
The formatters used for the File target should be writing to TextWriter instances to avoid creating extra string copies in memory.
Handling of errors
The file target is thought as a last-chance target, because by default, logs should be shipped from your nodes/machines to a central logging service. It can also be nicely put to use for local console apps that need to log to disk.
- Non-target-fatal IOExceptions, for example when NTFS ACKs file deletes but still keeps the file listable and available for some duration afterwards are retried on a case-by-case basis. Internal Warn-level messages are logged.
- Fatal IOExceptions – more other cases; directory not found, file not found, etc. are not retried. The target should crash and restart. Its current batch is then retried forever, while logging internal Fatal-level exceptions.
Invariants
- The File target is modelled as a transaction log and trades speed against safety that the contents have been written to disk, but does not do the bookkeeping required to use FILE_FLAG_NO_BUFFER.
- Fatal level events are automatically flushed/fsync-ed.
- Only a single writer to a file is allowed at any given time. This invariant exists because atomic flushes to files are only possible on Linux up to the page size used in the page cache.
- Only asynchronous IO is done, i.e. the Logary worker thread is not blocked by calls into the operating system. Because of the overhead of translating callbacks into Job/Alt structures, we try to write as much data as possible on every call into the operating system. This means that Messages to be logged can be ACKed in batches rather than individually.
- If your disk collapses while writing log messages (which happens once in a while and happens frequently when you have thousands of servers), the target should save its last will and then retry a configurable number of times after waiting an exponentially growing duration between each try. It does this by crashing and letting the supervisor handle the failure. After exhausting the tries, the batch of log messages is discarded.
- If there are IO errors on writing the log messages to disk, there's no guarantee that there won't be duplicate log lines written; however, they're normally timestamped, so downstream log ingestion systems can do de-duplication. This is from the batched nature of the File target.
Overview of buffers
- You write a Message from your call-site, this message is synchronised upon between the sending thread and the receiving thread using Hopac.
- If you use one of the logWithAck functions, placing the message in the RingBuffer can be awaited (or NACKed)
- If you use the logSimple function, the synchronisation is hoisted onto the concurrency scheduler's pending queue and raced with a timeout to be discarded if the logging subsystem is overwhelmed.
- Once the Message is in the RingBuffer of the File target, it's either removed by itself, or as part of a batch, to be serialised to string.
- The serialisation function reads through the values of the message and uses the formatter function to write those values into a TextWriter. The TextWriter is normally a StreamWriter writing to a FileStream. This means no extra strings need be created through concatenation.
- Depending on the inProcBuffer configuration flag, the TextWriter either supports buffering, which buffers the string inside the CLR process, or writes directly to the underlying file handle, which transitions the data to the kernel's ioctl subsystem. By default we don't buffer here.
- Depending on the flushToDisk configuration flag, the FileStream is or is not called with Flush(true), which forces a disk synchronisation. By default we let the page cache buffer these writes, to trade safety against throughput. This is similar to how most other targets work.
Depending on the writeThrough flag; Messages written with the File target is only ACKed when they are durably on disk. Defaults to true.
Note that disposing Logary, e.g. during application exit flushes all buffers.
Notes on FILE_FLAG_NO_BUFFERING
I've been considering supporting NO_BUFFERING but this would require callers to possibly wait for the 4096 bytes buffer to fill up before ACKing messages. However, for low-throughput logging, where each log line may be around, say, 240 bytes of text, having the NO_BUFFERING flag set may end up losing us more than it gains us.
References
- https://support.microsoft.com/en-us/kb/99794
- https://stackoverflow.com/questions/317801/win32-write-to-file-without-buffering
- https://winntfs.com/2012/11/29/windows-write-caching-part-2-an-overview-for-application-developers/
- https://msdn.microsoft.com/en-us/library/windows/desktop/cc644950(v=vs.85).aspx
- https://msdn.microsoft.com/en-us/library/windows/desktop/aa363772(v=vs.85).aspx
- https://stackoverflow.com/questions/8692635/how-do-disable-disk-cache-in-c-sharp-invoke-win32-createfile-api-with-file-flag
- https://stackoverflow.com/questions/122362/how-to-empty-flush-windows-read-disk-cache-in-c
- https://ayende.com/blog/174785/fast-transaction-log-windows
Example runs
These runs illustrate the above points in a more direct manner. In all of these cases we're writing 10K events to disk.
inProcBuffer = false, flushToDisk = true, caller awaits all acks at the end
This is the safest option and takes 1.3 seconds to log, format and write 10K messages.
I 2016-11-08T11:04:00.6125063+00:00: Event 1 [Logary.Samples.main]
number => 1
...
[12:04:02 DBG] Flushing to disk.
...
I 2016-11-08T11:04:02.0201345+00:00: Event 9402 [Logary.Samples.main]
number => 9402
[12:04:02 DBG] Flushing to disk.
I 2016-11-08T11:04:02.0201345+00:00: Event 9403 [Logary.Samples.main]
number => 9403
I 2016-11-08T11:04:02.0201345+00:00: Event 9404 [Logary.Samples.main]
number => 9404
...
I 2016-11-08T11:04:02.0891350+00:00: Event 10000 [Logary.Samples.main]
number => 10000
[12:04:02 DBG] Flushing to disk.
...
The interleaved flushes shows the batching functionality of the File target in action.
inProcBuffer = false, flushToDisk = true, caller awaits all ack after each
This example represents the worst-case usage of the safest configuration.
I 2016-11-08T11:14:42.9071732+00:00: Event 1 [Logary.Samples.main]
number => 1

[12:14:42 DBG] Flushing to disk.
I 2016-11-08T11:14:42.9711735+00:00: Event 2 [Logary.Samples.main]
number => 2
[12:14:42 DBG] Flushing to disk.
I 2016-11-08T11:04:02.0201345+00:00: Event 9403 [Logary.Samples.main]
number => 3
[12:14:42 DBG] Flushing to disk.
I 2016-11-08T11:04:02.0201345+00:00: Event 9404 [Logary.Samples.main]
number => 4
[12:14:42 DBG] Flushing to disk.
...
I 2016-11-08T11:15:04.7635448+00:00: Event 10000 [Logary.Samples.main]
number => 10000
[12:15:04 DBG] Flushing to disk.
With this configuration, the File target would still batch other threads' Messages but since this example has a single thread producer, there's only a single Message available for the target every loop.
inProcBuffer = true, flushToDisk = false, writeThrough=false caller awaits all acks at the end
This is the least safe and most speedy option. Useful when you're shipping logs away from the node and configure those shippers in a safer manner. In this case, .Net and the operating system and the device drivers decide when to flush.
On exit/dispose of Logary, all targets are always flushed.
[12:32:05 INF] Event 1
...
[12:32:06 INF] Event 10000
[12:32:48 DBG] Shutting down Logary.
...
[12:32:48 DBG] Flushing to disk.
In this example, the actual time taken is dominated by the time to generate the messages.
Work to be done
- Unit test rotation code
- Then enable rotation
- Harden against exceptions during writes – mock FileSystem
Stackdriver target
Development has been sponsored by Tradera.com.
Logary also includes a logging target for Google Cloud Stackdriver.
Configuration
The target can be configured like so:
open Logary.Targets.Stackdriver

let projectId = "your gcloud project id"
// either a custom name, or you can use one of the well-known stream names that you can retrieve from [the lists](https://cloud.google.com/logging/docs/view/logs_index)
// this name doesn't have to be url-encoded as per the spec, the target will do that for you
// the specified log should exist before use
let logname = "the stream you want to log to"
// create your monitored resource:
let resource = ComputeInstance("my zone", "my instanceId")
// or container:
// let resource = Container("my cluster", "my namespace", "my instanceID", "my pod", "my name", "my zone")
// or appengine:
// let resource = AppEngine("my moduleId", "my version")

let conf = StackdriverConf.create(projectId, logname, resource)
Then, within withTargets:
Stackdriver.create conf "target-name"
Further work
- batching
- flushing
- the underlying library doesn't provide a flush mechanism yet
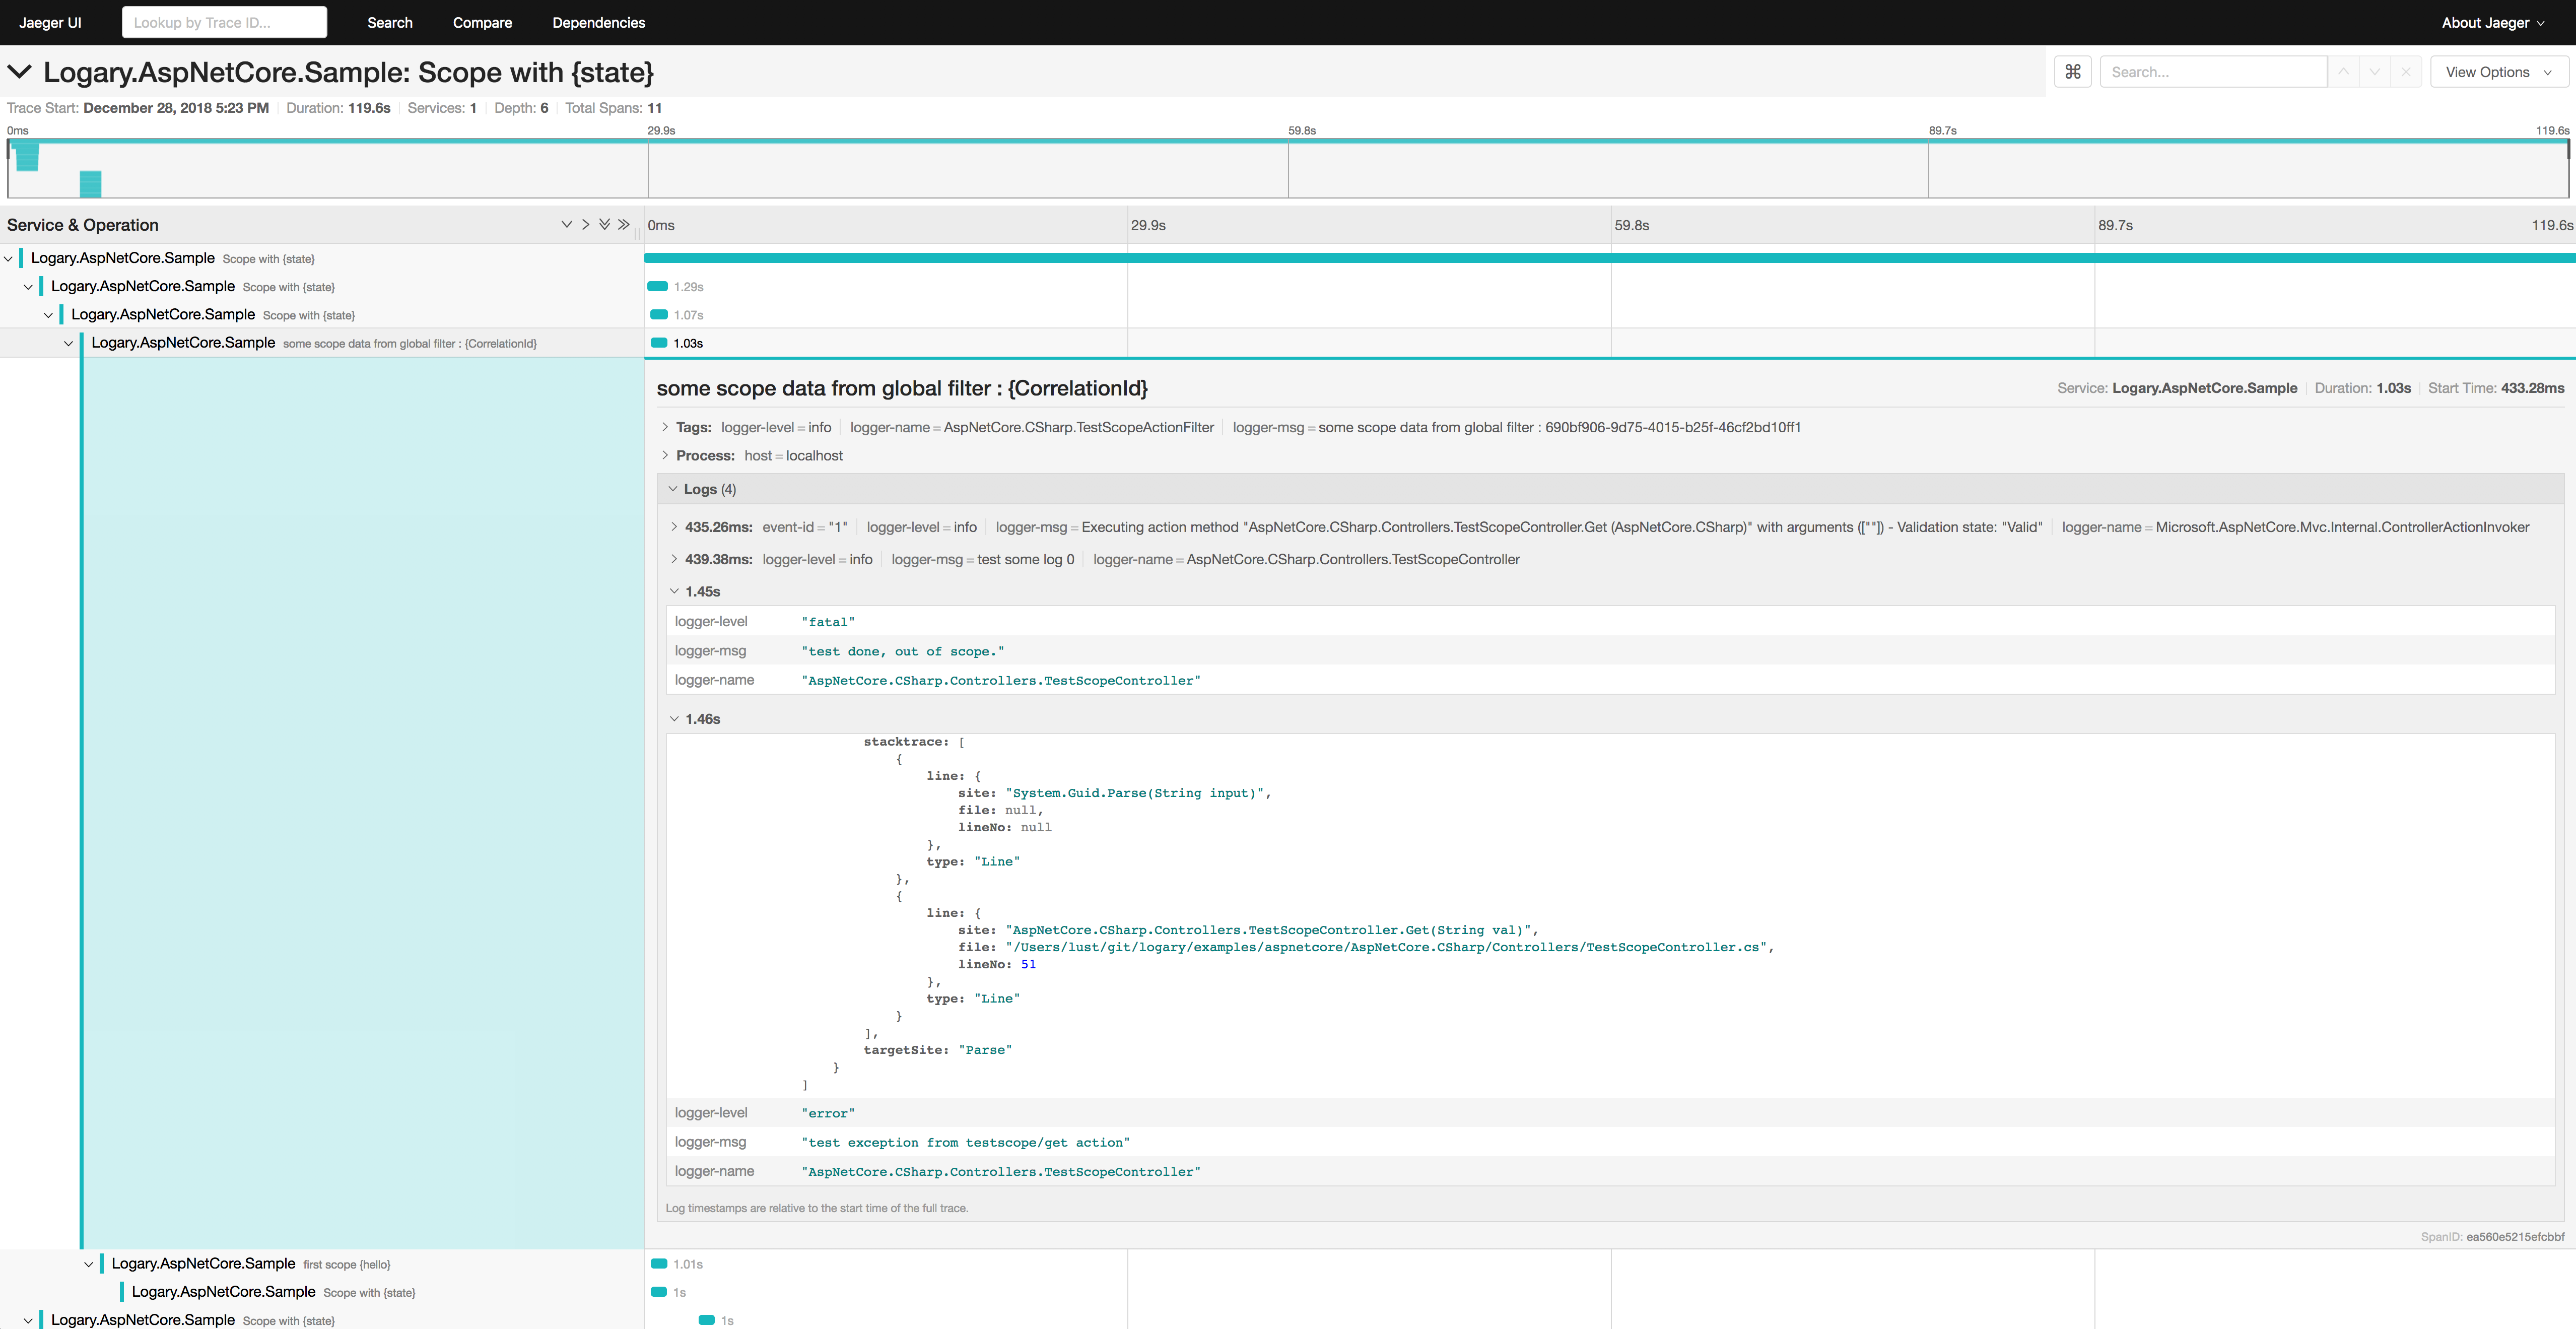
Jaeger tracing target
Install jaeger tracing
Usage
add ambientSpanId middleware to the target, if you want to use ambient span
jaegerTargetConf |> TargetConf.middleware Middleware.ambientSpanId
then create span for some tracing, log message as usual:
use rootSpan = logger.buildSpan () |> Span.setMessage (eventX "root span") |> Span.start

do! eventX "before some action: {userId}" >> setField "userId" 123 |> logger.infoWithBP

// do some action : ...

do! eventX "after some action: {orderId}" >> setField "orderId" 321 |> logger.infoWithBP

let conStr = "Host=;Database=;Username=;Password=;"

use childSpan = Span.create logger |> Span.setMessage (eventX "child span" >> tag "DB Query" >> tag "Postgresql" >> setContext "conn str" conStr) |> Span.start

let sql = "select count(*) from xxx"
do! eventX "query : {sql}" >> setField "sql" sql >> setTimestamp (Instant.FromUnixTimeSeconds 1L) |> logger.infoWithBP
if not using ambient span, you can use Message.setSpanId for log message and Span.setParentSpanInfo for childSpan creation.
do! eventX "after some action: {orderId}" >> setField "orderId" 321 >> setSpanId rootSpan.info.spanId |> logger.infoWithBP

// use explicitly setParentSpanInfo style, since we use hopac `do! timeOutMillis 100` before (the ambientSpanId middleware will not be guaranteed)
let childSpan = Span.create logger |> Span.setMessage (eventX "child span" >> tag "DB Query" >> tag "Postgresql" >> setContext "conn str" conStr) |> Span.setParentSpanInfo rootSpan.info |> Span.start
What does it look like?
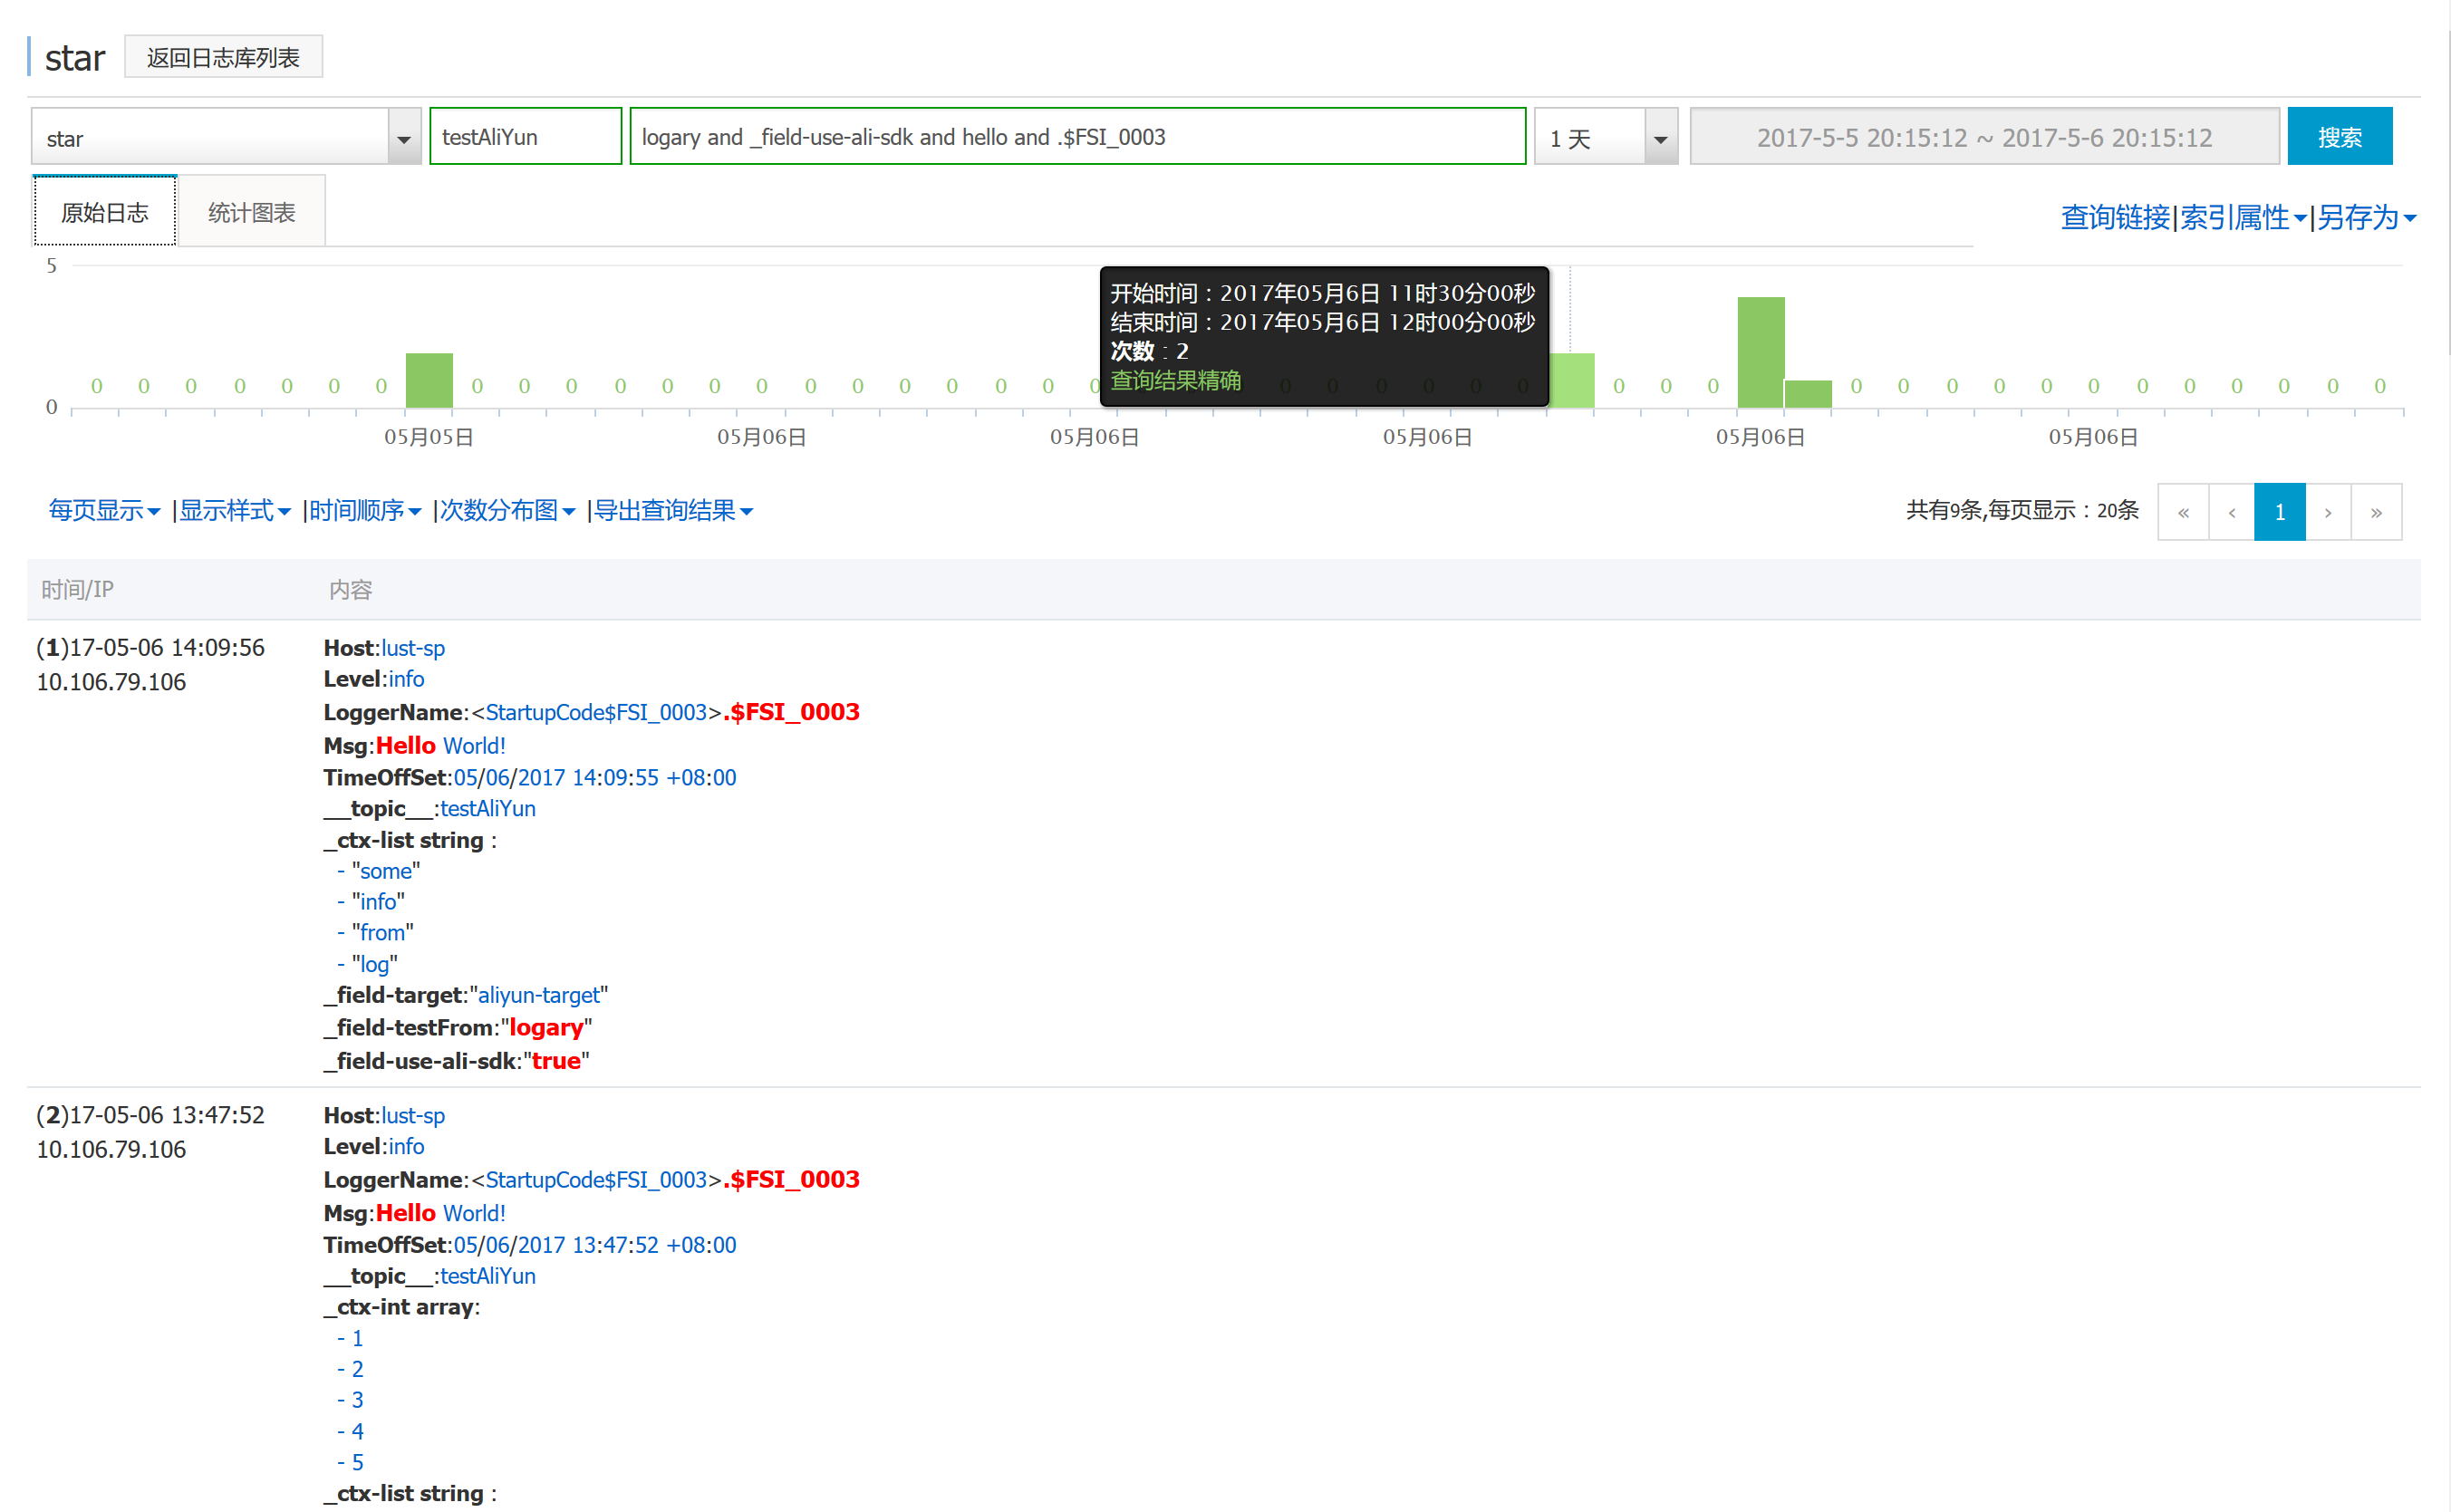
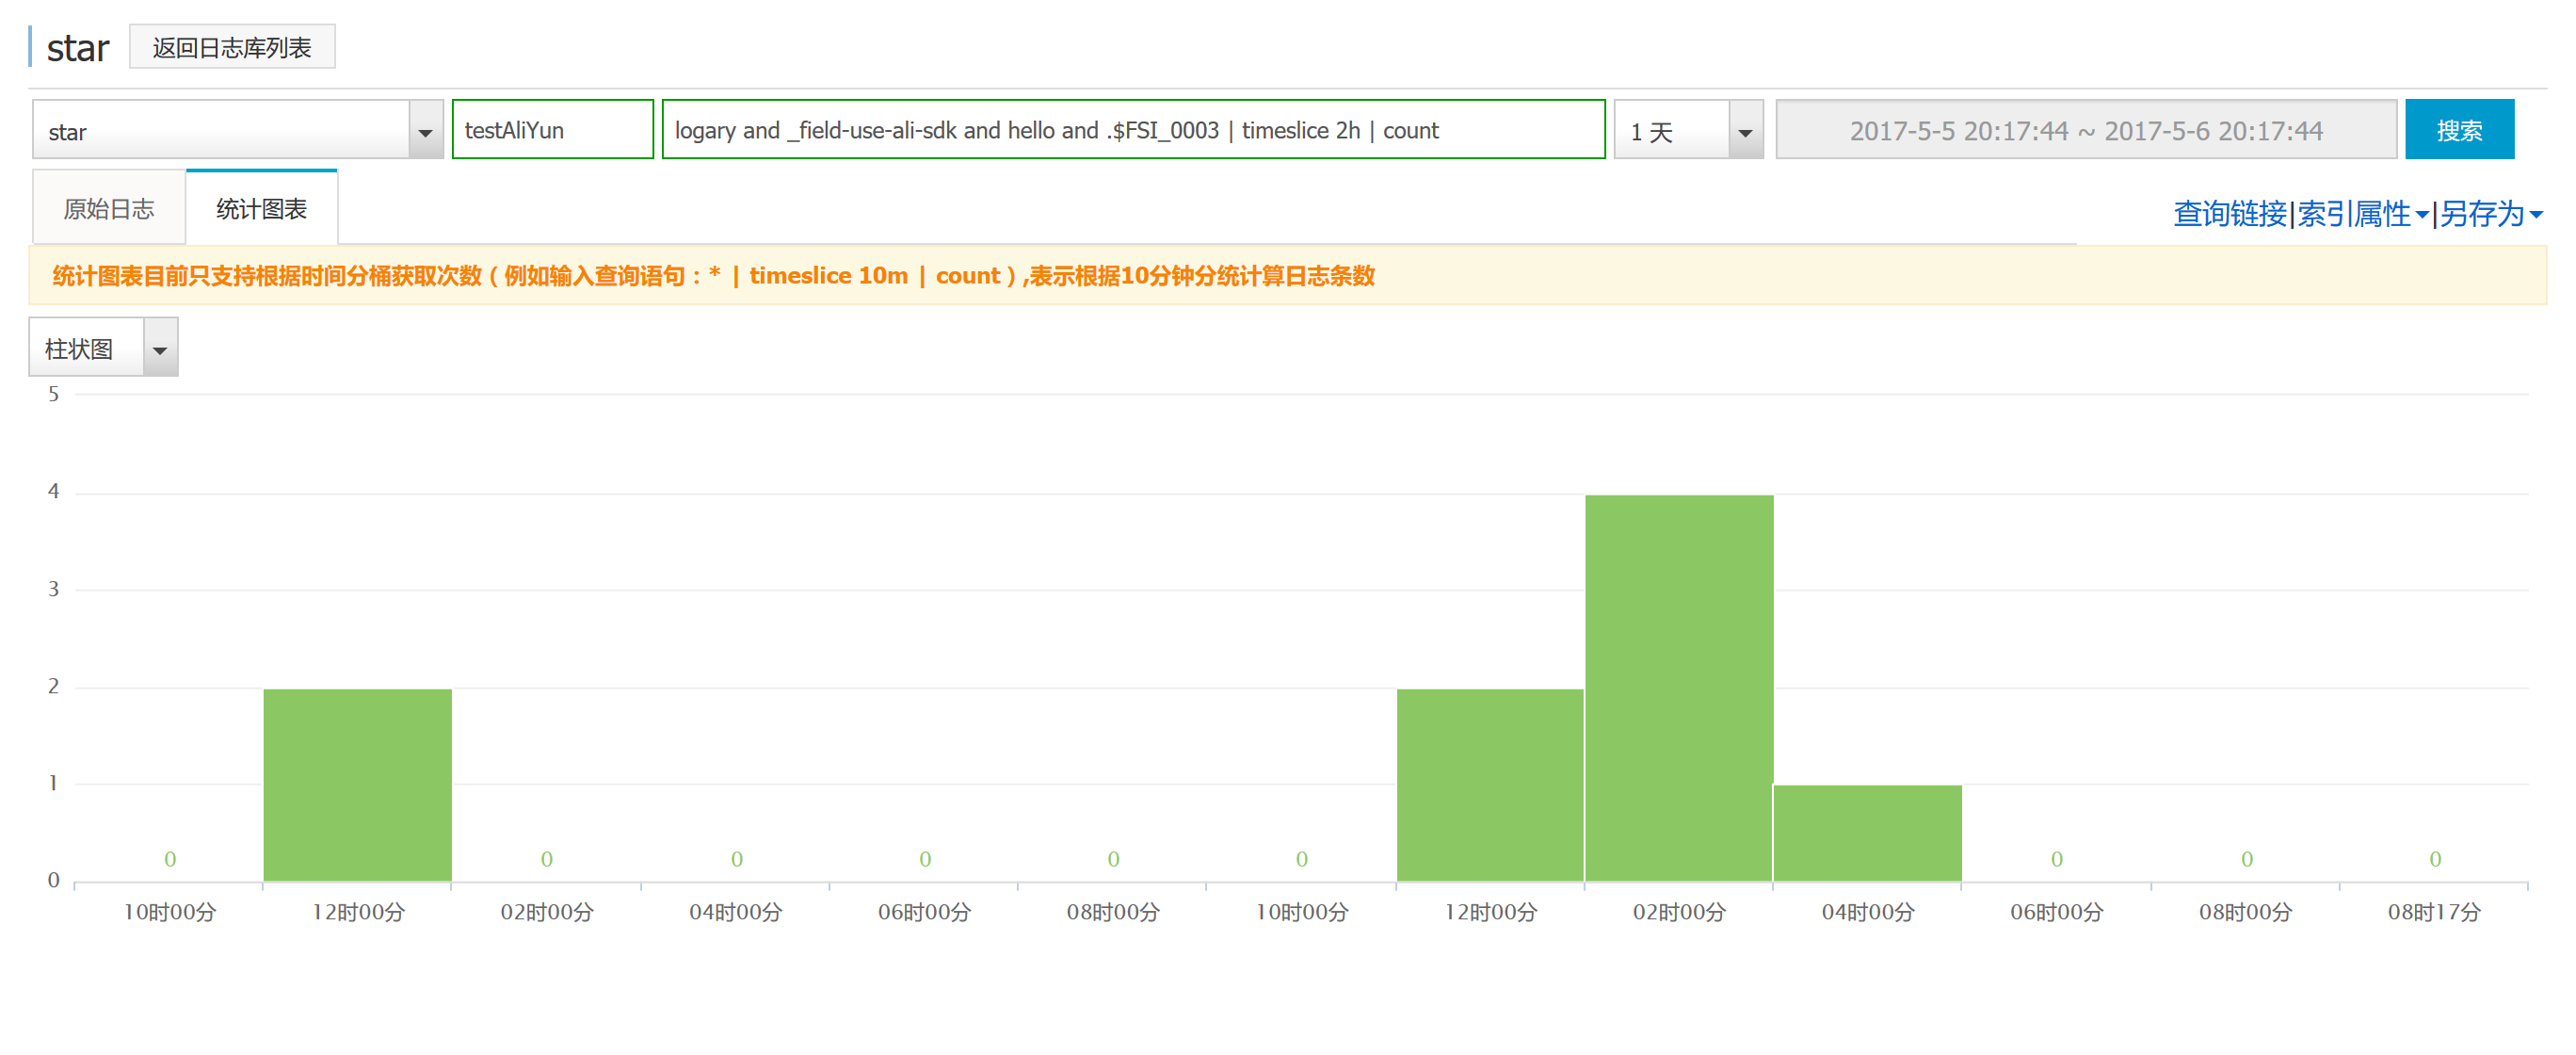
AliYun Log Service target
Usage
LogaryFactory.New("demoService", conf =>
    conf.InternalLoggingLevel(LogLevel.Verbose)
        .Target<Debugger.Builder>("internal.debugger", tb => tb.UseForInternalLog())
        .Target<Logary.Targets.Console.Builder>("internal.console", tb => tb.UseForInternalLog())
        .Target<LiterateConsole.Builder>("console1")
        .Target<AliYun.Builder>("AliYunLog", tb => {
             tb.MinLevel(LogLevel.Verbose)
             .Target
             .ConfClient("key",
                         "keyid",
                         "endpoint")
             .ConfLogLocation("project", "logstore")
             .SetConnectTimeOut(1000)
             .SetReadWriteTimeOut(5000)
             .Done();
        })
);
What does it look like?
Azure AppInsights target
Target for Microsoft Azure AppInsights logs the events as TRACE-messages (or Events/Metrics with a different MappingConfiguration). You need to set the API-key first. Then when you go to Azure Portal Application Insights and Overview -> Search you should be able to find the targets from there. Metrics goes to Metrics Explorer -> Add Chart -> Custom. More info...
Commercial targets
Logary is a production-grade logging and metrics library. We've also built targets that integrate with external paid services. These are listed here.
Mixpanel
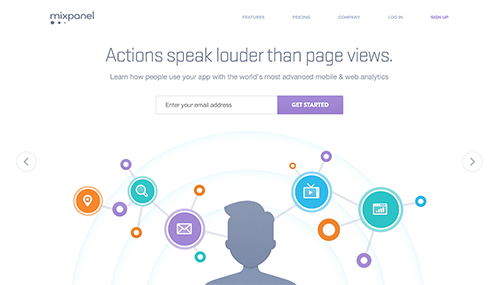
Learn how people use your app with the world's most advanced mobile & web analytics.
[Purchase today](mailto:henrik@haf.se?subject=Logary Mixpanel Target)
Features
- Ship logs from your iOS, Android app
- Ship logs and handle user identification and unique-id tracking from web
- Use your own domain and server (over HTTPS)
- Logary listens on your server and forwards your events into Mixpanel
- Add granular server-side event filtering/enriching/correlation for better insights before shipping them onwards.
- Log web app usage even when Mixpanel is blocked client-side
What's included?
We like open source – so in the purchase the reference source is provided so that it can be debugged like the rest of Logary.
Send an e-mail to purchase
This assumes you have an account at Mixpanel.
OpsGenie

You can't rely on any one notification method for critical alerts. Get alert notifications via iOS & Android push, SMS, and phone calls; escalate automatically to team members if the alert is not acknowledged.
The Logary target for OpsGenie ensures that you can bring in your Logging and Metrics into your daily operations.
Features
- Connect using your own API key
- Make Logary events into new alerts
- Supports custom 'enrichers' to let you specify e.g. user, teams, recipients, tags, entity and notes, to name a few.
- Ready to use from both F# and C#
- Use derived metrics to create load-level alerts
- Stay on top of your infrastructure
- Avoid blacklisting your transactional e-mail service
This assumes you have an account at OpsGenie.
elmah.io
source https://www.nuget.org/api/v2
nuget Logary.Targets.Elmah.Io
OR:
Install-Package Logary.Targets.Elmah.Io
Usage
Configure elmah.io just like you would any normal target.
#if INTERACTIVE
#I "bin/Release"
#r "Hopac.Core.dll"
#r "Hopac.dll"
#r "NodaTime.dll"
#r "Logary.dll"
#r "Logary.Riemann.dll"
#endif

open System
open NodaTime
open Hopac
open Logary
open Logary.Configuration
open Logary.EventProcessing
open Logary.Targets
open Logary.Targets.ElmahIO
open System.Threading

[<EntryPoint>]
let main argv =
  use mre = new ManualResetEventSlim(false)
  use sub = Console.CancelKeyPress.Subscribe (fun _ -> mre.Set())

  let logary =
    let elmahioConf =
      { logId = Guid.Parse(Environment.GetEnvironmentVariable("ELMAH_IO_LOG_ID"))
        apiKey = "api key form elmah io"}

    Config.create "Logary.ElmahIO" "localhost"
    |> Config.targets [
        Console.create Console.empty "console"
        ElmahIO.create elmahioConf "elmah.io"
      ]
    |> Config.processing (Events.events |> Events.sink ["console";"elmah.io";])
    |> Config.build
    |> run

  let logger =
    logary.getLogger (PointName [| "Logary"; "Samples"; "main" |])

  Message.eventFormat("{userName} logged in", [| "haf" |])
  |> Logger.logSimple logger

  Message.eventFormat (Info, "{userName} logged in", [| "adam" |])
  |> Logger.logSimple logger

  mre.Wait()
  0
Or from C#:
// ...
.Target<ElmahIO.Builder>(
  "elmah.io",
  conf => conf.Target.WithLogId("GUID_HERE"))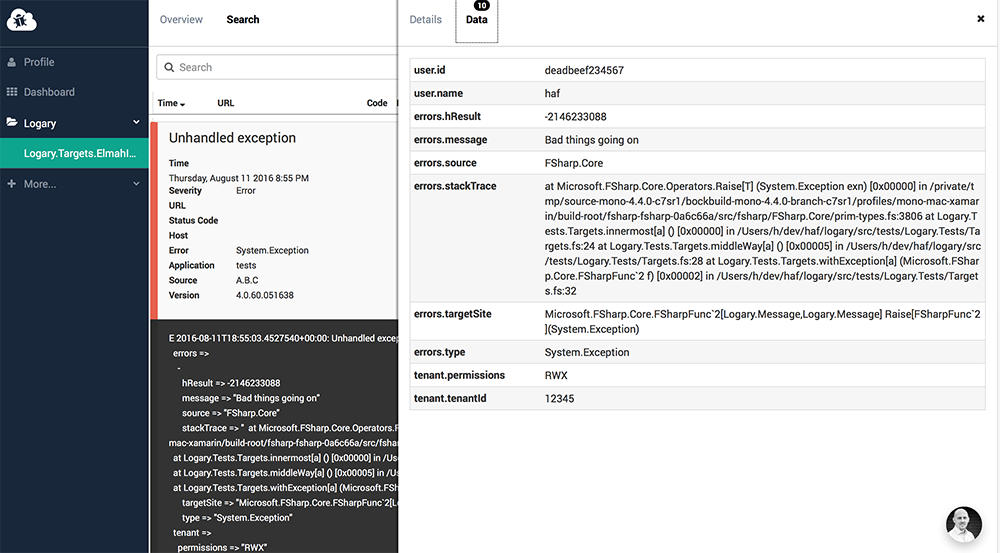
You'll get the same view by logging this Message:
type Tenant =
  { tenantId : string
    permissions : string }

let exnMsg =
  Message.event Error "Unhandled exception"
  |> Message.setSimpleName "A.B.C"
  |> Message.setFieldFromObject "tenant" { tenantId = "12345"; permissions = "RWX" }
  |> Message.setContextFromMap (Map
    [ "user", box (Map
        [ "name", box "haf"
          "id", box "deadbeef234567"
        ])
    ])
  |> withException Message.addExn
This assumes you have an account at elmah.io.
SumoLogic (community-contributed)
SumoLogic is a hosted service (at about 99 USD per month) that unifies logging, metrics, analytics and dashboards in a single service. As such it's a perfect Target for Logary, since Logary supports both logs and metrics.
Have a look at @neoeinstein's Logary.Targets.SumoLogic for the official docs and a sample of how to use it.
source https://www.nuget.org/api/v2nuget Logary.Targets.SumoLogic
Want your SaaS-logging service as a Target?
Absolutely! You have two options;
- Send a PR with your target that is of equivalent quality as the rest of the code-base, including documentation, code-doc, the C# builder API and a sample in this file. Then keep that code up-to-date when Logary evolves and your SaaS service changes its APIs.
- Send me an e-mail and I'll target the target for you. Pricing: a small initial fee and then a monthly maintenance fee, you'll have a beautiful way of getting logs and metrics to your servers!.
This is by far the easiest option and ensures that your Target is stable and easy to use for your customers. I'll even write some Markdown/HTML-formatted docs for your site about how to use Logary with your target.